The YASEP simulator is unlike other tools like GDB. The YASEP architecture is intended to be multithreaded at the hardware level (simultaneous multithreading), so the simulator is modular, made of a collection of tools/windows that interact with each other. You can reconfigure the links between modules, or the modules contents, at any time, even during simulation. You can even simulate different systems at the same time !
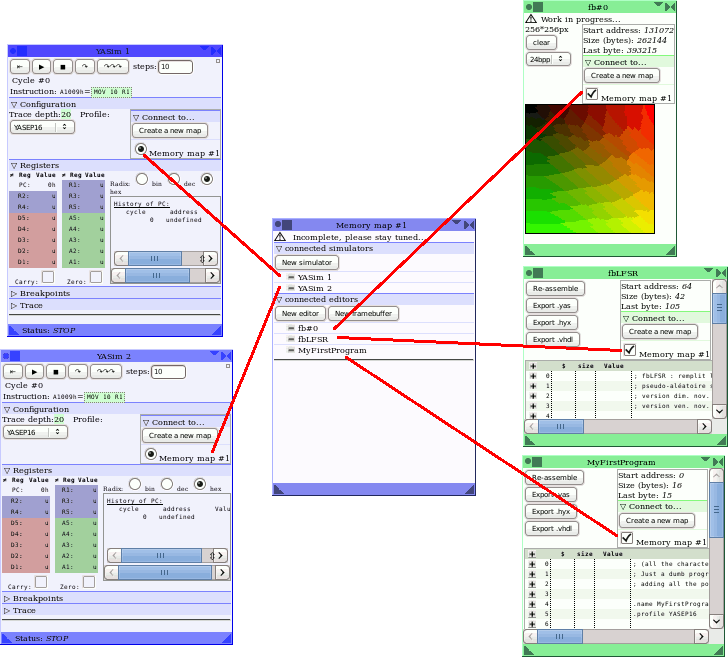
The following picture shows a simulation that runs two YASEP cores, two source code windows and one framebuffer.
In the middle, the window called "Memory map" represents both the computer system and a project (with its own configuration and resources). There can be more than one, each manages a separate address space (from the point of view of the CPU cores).
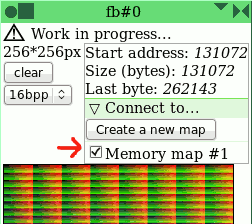
The address space is populated with ASM editor windows (YASMed) and framebuffers (more tools will be created). Be careful to prevent overlap of their address ranges (the behaviour is not defined otherwise). These windows may be accessed by more than one memory map, but at the same address in every address space (this should be moved to the mmaps but this would be too complex for the labels and addresses).
The address space is accessed by CPU cores through their designated memory map. There can be as many CPU as your browser can handle.
You can create and assemble the system from anywhere thanks to the connexion areas located at the top-right of the capable windows.
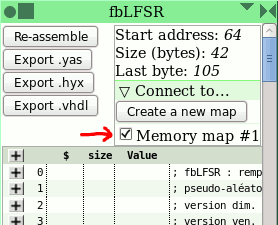
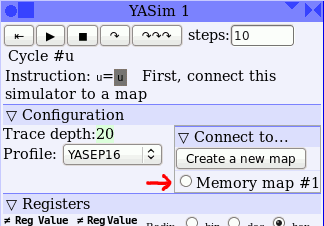
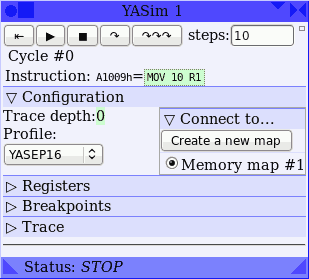
For example, you clicked on source code in a tutorial or in the First Run window. This opens a YASMed window that is not connected. If there is no open memory map, YASMed suggests to click on a button to create one, otherwise you select which map(s) may access the code.
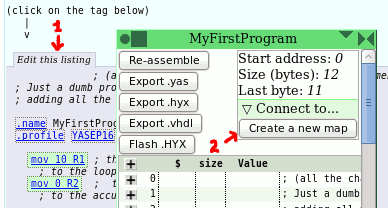
The "Create a new map" button opens a new window, with a link to the YASMed window that called it. You can then simulate it by clicking on the "New Simulator" button, which opens a new window connected to your memory map.
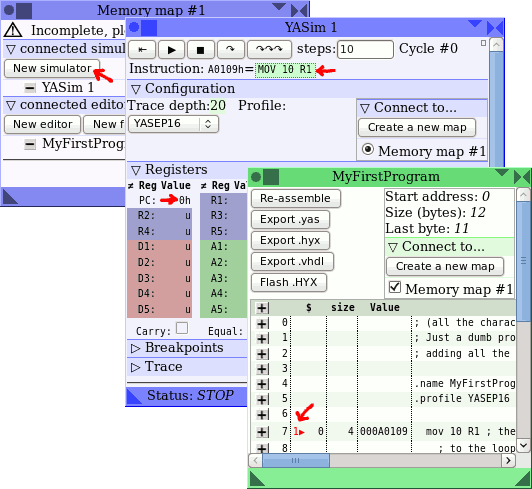
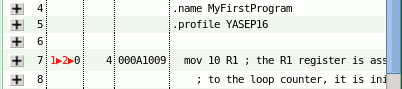
The CPU is reset and fetches its first instruction from address 0. If the source code provides this address, you can see the corresponding value and the decoded opcode in the YASim window. It also places its cursor on the corresponding line for visual feedback. There can even be more than one CPU executing from the same location:
The YASEP simulator is intended for deep and accurate examination of each element of the system. It is not (yet) multithreaded and each core executes one cycle in a round-robin loop. Each core conserves a log of past values, which take room and actual CPU cycles to update and display.
The simulator can execute from hundreds to thousands of YASEP instructions per second, equally allocated to each simulated core. The logs and the browser display take significant time so if you want to increase the simulation speed: